Network as a Service (NaaS) PlayBook
1. TX Performance Introduction
The Tx performance management (mgmt) module provides NaaS operators with background information and methodologies to review and improve the performance across the transport network. It provides guidelines to identify and mitigate performance issues to maintain the required performance level.
Tx performance mgmt is essential to ensure the performance and availability of the services on the transport network. Any disruption on the network can negatively impact customer satisfaction and, ultimately, NaaS operator’s revenue. Therefore, standardized performance mgmt processes are imperative to efficiently identify degradations in the network performance.
Through the use of this module, NaaS operators will understand the Tx performance mgmt tasks to monitor, detect and prevent unwanted performance situations. Furthermore, methodologies to analyze and diagnose these situations are provided to identify network configurations that help in their mitigation.
1.1 Module Objectives
This module will enable a NaaS operator to identify and mitigate performance degradations on the transport network. The specific objectives of this module are to:
1.2 Module Framework
The module framework in Figure 1 describes the structure, interactions and dependencies among different NaaS operator areas.
Strategic plan & scope and high-level network architecture drive the strategic decisions to forthcoming phases. Once the network is in operations, field maintenance and post-launch engineering activities are required to ensure the proper functioning of the network.
The Tx performance mgmt module is included within the post-launch engineering stream and has a direct relation with the field maintenance and the operations & maintenance streams, as can be seen in Figure 1.
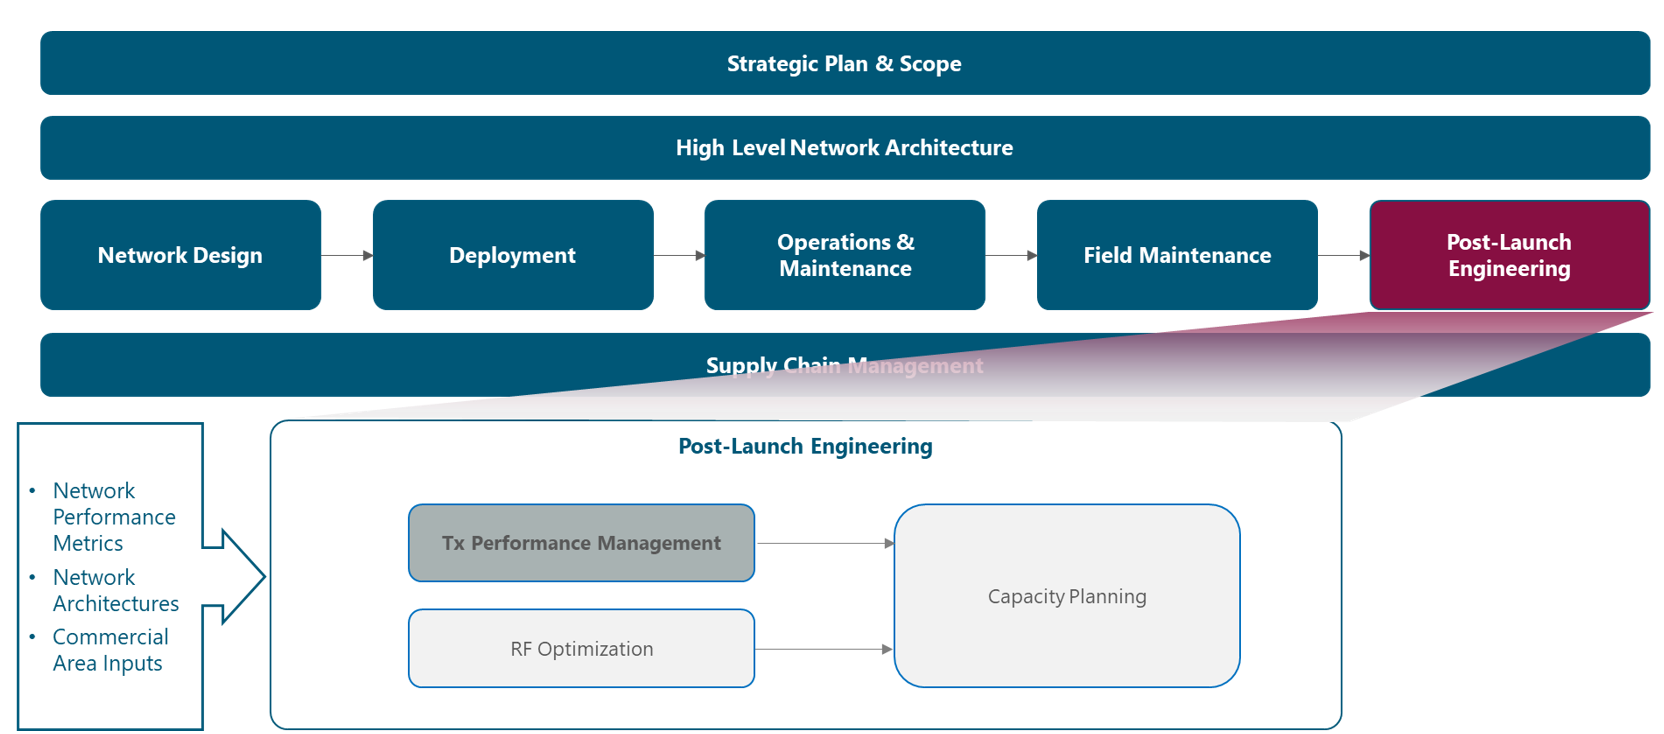
Figure 1 — Post-Launch Engineering Framework
Figure 2 presents the Tx performance mgmt process, where the main components are exhibited.

Figure 2 — Tx Performance mgmt Process
The rest of this module is divided into three sections. Section 2 is a bird’s-eye view of the Tx performance mgmt fundamentals. Once fundamental knowledge is acquired, an examination of the required process inputs is provided in Section 3. Finally, Section 4 describes an E2E process flow that can be used as-is or be adapted by NaaS operators to match their particular conditions.
2 Tx Performance Management Fundamentals
This section provides a general overview of the baseline concepts of the Tx performance mgmt process and its relevance for NaaS operators.
2.1 Tx Performance Management Imperative
Tx performance mgmt is the set of activities (i.e., data collection, detection, analysis and diagnostic, implementation) to ensure a consistent and predictable level of service in the transport network. Tx performance mgmt process helps monitor and identify performance degradations in the transport network, ensuring that the issues are mitigated, and the network is restored to the required performance level.
In a mobile environment, the transport network interconnects disparate networks, including the radio access network (RAN), data centers, and external networks. Figure 3 displays the architecture of a typical transport network.
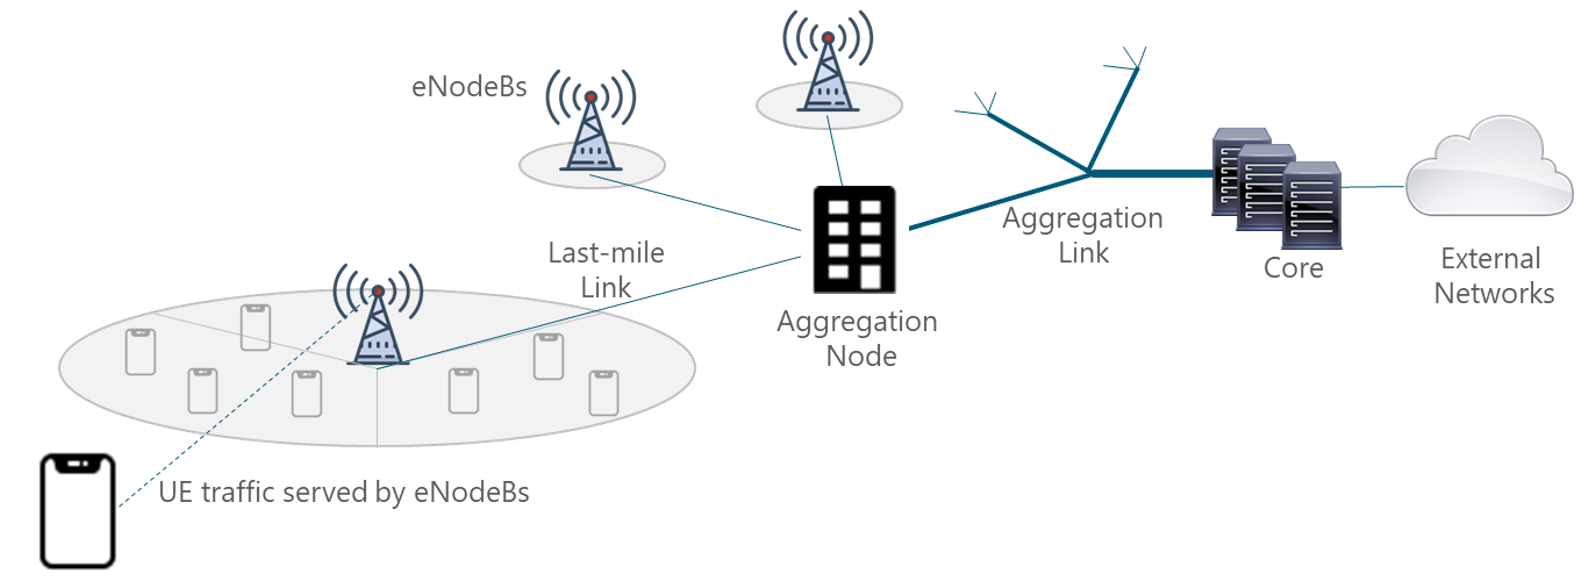
Figure 3 — Typical mobile network architecture
Different segments exist on the transport network that, for most of NaaS operators can be classified as: last-mile and aggregation level. Thus, the overall Tx network performance is determined by the performance of the network elements one by one, each network segment, and ultimately, the performance of the network as a whole (i.e., the combination of the performance of all network elements), as displayed in Figure 4.
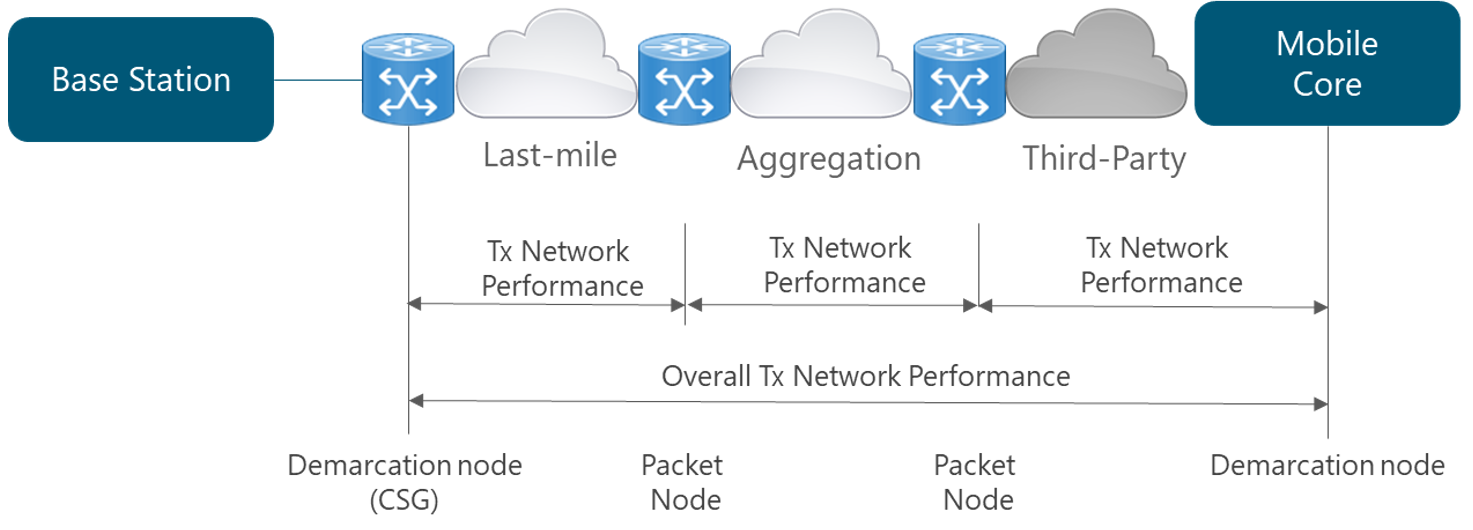
Figure 4 — Typical mobile network architecture
Tx performance mgmt is essential to ensure the performance and availability of the services on the different segments of the transport network. Any disruption on the network can negatively impact customer satisfaction and, ultimately, NaaS operator’s revenue.
The relationship between capacity planning and performance mgmt relies on their specific scope. Performance mgmt focuses on optimizing the existing network elements to improve the performance. In contrast, capacity planning determines the future network requirements using the current performance as a baseline.
2.2 Tx Performance management Use Cases
In this section, a review of the main Tx performance mgmt use cases is presented, highlighting the relevance and applicability to the NaaS operator.
A deeper view of the use cases for Tx performance mgmt and their associated activities can be found on the Primer on Network Performance.
2.2.1 Service Level Agreement Management
This use case is a continuous task to ensure that the performance network complies with the offered service levels. A service level agreement (SLA) is a formal agreement between two or more entities that is reached after a negotiating activity, with the scope of assessing service characteristics, responsibilities and priorities of each part. An SLA may include statements about performance, tariffing and billing, service delivery and compensations.
To ensure SLA compliance, NaaS operators must perform the following activities:
The areas where Tx key performance indicators (KPI) should be constantly monitored as part of the SLAs include the following:
For more information about Tx KPIs that are required to be monitored along with their typical values for NaaS operators, please refer to Section 4.2.
2.2.2 Service Degradation
This use case focuses on the inspection of any degradation in the performance KPIs that could lead to future service outages. To this end, the Tx network performance indicators are constantly monitored to early detect performance degradation and quickly apply corrective actions to get back to target KPI values.
The areas where Tx performance indicators should be constantly monitored include the network delay, availability and packet loss. However, other areas like resiliency and quality of service must be continuously monitored to ensure their proper behavior.
The approach for this use case is usually still reactive. In many operators, performance mgmt groups are organized in different tiers (tier-1 being able to perform basic checks in the network elements to tier-2/tier-3 providing more specialized professional services to understand and apply fixes to complex network issues) are focusing their activities in generating a diagnose (i.e., finding the root cause analysis) of the degradation and then prescribing and executing a solution to fix it.
Customer issues or complaints are a trigger to launch the performance mgmt activities. Sometimes these issues get hidden in overall network performance statistics and cannot be detected via network performance indicators monitoring. An in-depth view of the monitoring activities can be found in the Network Operation Center (NOC) Module.
2.2.3 Transport Network Optimization
This use case aims to improve the network performance continuously. The primary purpose is to identify potential actions to improve the overall performance of the transport network. The most common optimization activities focus on the improvement of specific performance indicators, such as those related to:
As mentioned before, the Tx performance mgmt activities associated with Network Optimization are executed continuously. The approach can be both reactive (i.e., NaaS operator responding to a ‘known’ problem) or proactive (i.e., NaaS operator is exploring ways to improve results in specific KPIs). These activities prevent the customer churn due to service degradation and ensure the network performance when additional customers are included in the network.
2.2.4 Transport Network Troubleshooting
The aim of this use case is to investigate, diagnose and resolve service degradations and/or faults in the transport network elements. The main purpose is to filter and solve performance-related issues within the timeframe specified by service levels.
The typical troubleshooting process flow for the transport network can be described in the following steps:
Table 1 displays the typical issues in transport networks along with their most common problems and their potential solutions.
|
Issue |
Most Common Problems |
Solution |
|
Increase in packet loss rate |
Maximum transmission unit (MTU) Size Mismatching |
– Homologate MTU size across all the elements in the Tx network. |
|
Interface Speed Mismatching |
– Ensure proper interface speed configuration on both sides of the transport link. |
|
|
Network Congestion |
– Increase the capacity of the transport link. |
|
|
Connectivity Issues |
Firewall Blocking Problem |
– Ensure the proper firewall configuration to allow NaaS operator traffic. |
|
Route Flapping Issue |
– Increase the routing protocol timers to calculate new routes. – Alternatively, create static routes for specific services. |
|
|
Increase in network delay |
Routing Protocols Metrics |
– Adjust and homologate routing protocol metrics across all network elements to consider network delay. |
|
Network Congestion |
– Increase the capacity of the transport link. |
Table 1 — Tx Network typical issues and potential problems and solutions
3 Performance Management Inputs
This section includes a description of the primary data sources used to execute Tx performance mgmt activities.
3.1 Tx Performance Counters and Measurements
Tx performance counters and measurements are collected from transport network elements (e.g., routers, microwave radios, switches) and/or network monitoring systems. Tx performance measurements are the primary input for the mgmt process.
It is recommended to the NaaS operator to use tools to automate the activities of collection and processing of the performance files, and when possible, automate also the real-time detection of Tx performance degradations (i.e., deviations from established thresholds).
Tx performance measurements can be built into the network monitoring systems (NMS) and be automatic. For a more detailed view of the NMS characteristics, please refer to the Network Monitoring Architecture Module. Regarding measurements, there are two methodologies for measuring Tx performance:
Performance measurement values are stored every reporting output period (ROP) with a typical granularity of 15 min. Performance measurements are then aggregated by performance reporting tools to generate aggregated information with different time scopes (daily, monthly, weekly) and different geographical scope (by city, province, region or network).
More detailed regarding the actual measurement methods for each of the areas of interest are presented in Section 4.2.
3.2 Network Inventory / Topology
Network inventory is the record of information regarding all elements in the network. It comprises sets of data that are not usually stored in the network element mgmt systems.
When performing performance mgmt activities in the transport network, it’s important to have accessibility to databases that contain the data from devices in the network presented in Table 2.
|
Inventory Data |
|
|
General Data |
Device name |
|
Device IP address(es) |
|
|
Device location |
|
|
Layer 2 Data |
Device’s MAC address(es) |
|
Connection Information (e.g., switch 1 port 2/1 connects to switch 2 port 1/1) |
|
|
VLAN information |
|
|
Information on layer 2 redundant paths (e.g., redundant bridged paths, port channels) |
|
|
Layer 3 Data |
Layer 3 connectivity information (e.g., default routes, routing tables) |
|
Information on layer 3 redundant paths (e.g., HSRP, VRRP router peers) |
|
|
Additional Data |
Device function |
|
Logical access methods (e.g., passwords, community strings) |
|
|
Physical access methods (e.g., keys, badges) |
Table 2 — Network Inventory data for Tx devices
Furthermore, the data regarding the Tx links presented in Table 3 is also required.
|
Inventory Data |
|
|
General Data |
Link name / code |
|
Link technology (e.g., FO, MW, Satellite) |
|
|
Link capacity |
|
|
Connection Information (e.g., switch 1 port 2/1 connects to switch 2 port 1/1) |
|
|
FO Link |
Number of FO strands (total and in-use) |
|
MW Link |
Link Frequency |
|
Link Modulation |
|
|
SAT Link Data |
Pointed Satellite |
|
Satellite Band (e.g., Ka, Ku) |
|
|
Satellite Beam |
Table 3 — Network Inventory data for Tx links
The following snapshot displays an example of an inventory tool that collects information about network inventory of the transport network. Please, see the Network Operation Center (NOC) Module for more details on the required activities to manage the network.
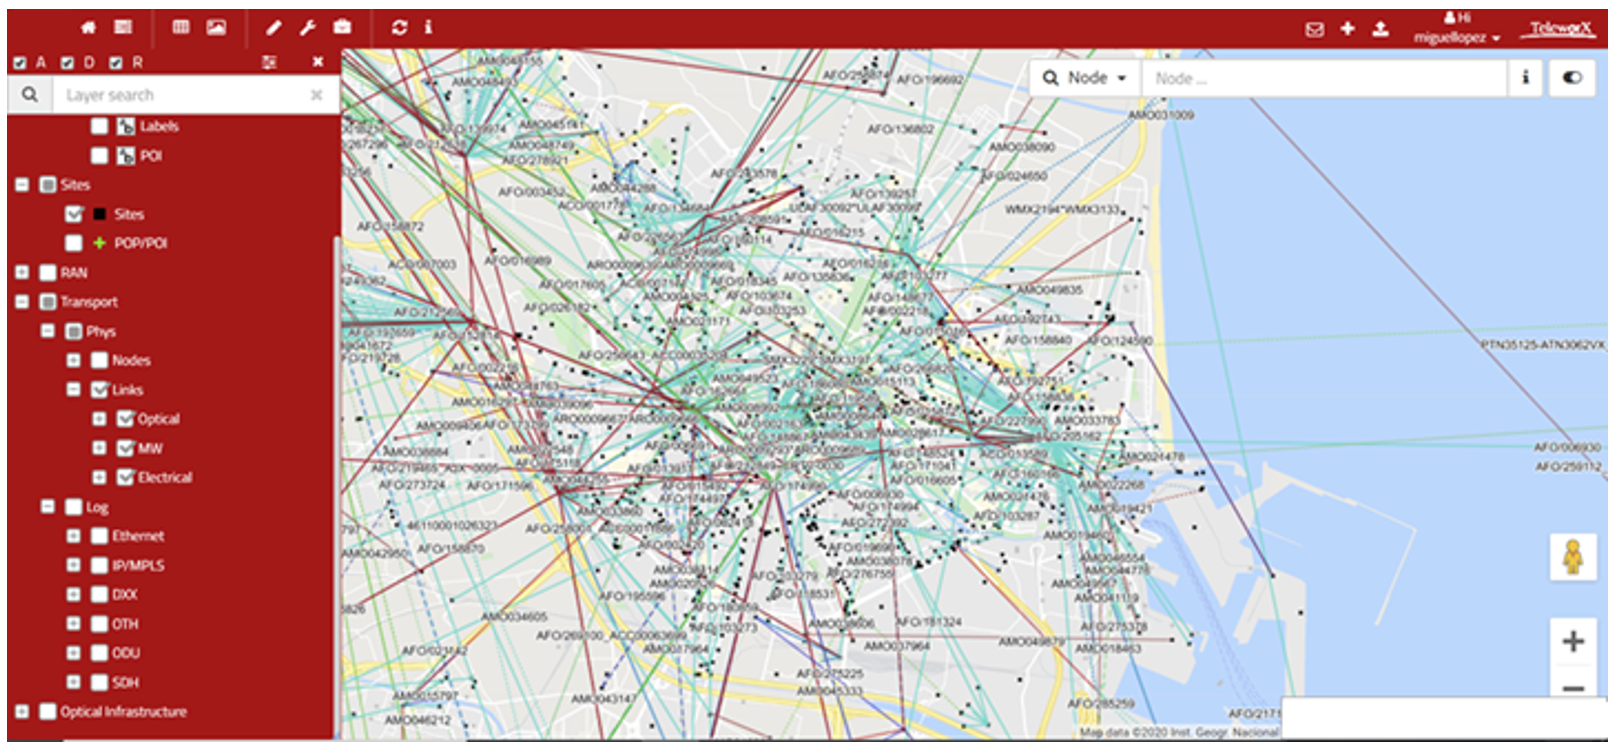
Figure 5 — Transport network Inventory data and tool UI
It is highly recommended to perform periodic network audits to obtain the required information to maintain an accurate and updated inventory of the transport network.
3.3 Network Alarms / Faults
Analysis of the health status of any particular network element requires the detection of the faults/alarms and the notification to the operations systems (equipment mgmt system and/or NMS). Therefore, lists of active alarms in the network as well as alarm historical data are relevant for troubleshooting activities.
Faults are usually grouped into the following categories:
Additionally, a priority must be defined for each fault according to the impact on the network performance. Following, some aspects that can be used to define the fault priority:
NMSes provide interfaces and reporting capabilities to retrieve fault mgmt (i.e., alarms) information from network elements and exporting functionalities if processing outside of the NMS was required. Protocols used in this interface to provide fault mgmt information include:
3.4 Tx Configuration
Transport network elements are configured via parameters that determine their interactions within the network. These parameters control relevant features spanning from the routing protocols, redundancy and protection methods, and many others.
It’s critical for performance mgmt activities to maintain databases updated with configuration data so that the performance mgmt process can rely on proper settings of the analyzed network elements. When performing Tx performance management, it’s important to be able to quickly correlate issues with possible configuration modifications or inconsistencies in the affected network elements.
Update periodicity of configuration management (CM) databases can be scheduled by the NaaS operator depending on known variability (how often is the network configuration being modified). As an example, it could be possible for an operator that last-mile elements configuration is stable enough to use monthly updates, whereas the refresh of the aggregation elements could need to be performed weekly. For a more in-depth examination of the CM activities, please see the Network Operation Center (NOC) Module.
The collection and processing of configuration data should be completely automated, as well as the detection of configuration inconsistencies.
Configuration information from network elements is typically accessible via text files (typically in xml formats). These files contain the settings of the parameters/attributes organized by logical objects (managed objects) that follow a hierarchical or functional structure.
3. PERFORMANCE MANAGEMENT INPUTS
3.1 Tx Performance Counters and Measurements
3.2 Network Inventory / Topology
3.3 Network Alarms / Faults
3.4 Tx Configuration
Next ⇒
4 Tx Performance Management Process
This section presents a generic yet customizable E2E process flow to perform the Tx performance mgmt in NaaS operator’s network. An examination of each of the Tx performance mgmt process’ steps are’ provided to instruct NaaS operators on their implementation. Furthermore, this section describes the most relevant network areas that NaaS operators should consider as part of the Tx performance mgmt process.
4.1 Process Overview
This section chapter aims to provide NaaS operators with a description of the tasks included in the Tx performance mgmt process, which is represented in Figure 6.

Figure 6 — Tx Performance mgmt Process tasks
Data Collection
Tx performance data collection is the process of collecting performance-related mgmt data from network devices and storing them in a database or data file. The Tx performance mgmt team of the NaaS operator will be responsible for monitoring the network performance and the quality perceived by the customers. This will be achieved by monitoring and analyzing the Tx performance KPIs, allowing the detection of the network elements that negatively impact on the network performance and in the customer perception.
This process is an on-going activity composed of an ‘offline’ and an ‘online’ component. In the ‘offline’ monitoring, Tx engineers will usually review and troubleshoot the Tx KPIs from the previous day(s). These ‘offline’ activities will be complemented by an ‘online’ monitoring, where the NOC of the NaaS operator will continuously monitor the status of the nodes (i.e., absence of alarms affecting the provided service). The NOC monitoring should work on a 24×7 approach (please refer to Network Operation Center (NOC) Module for additional information on NOC activities).
Detection
Tx performance mgmt team will be responsible for detecting the network performance degradations that impact the quality of services perceived by the customers or the system performance. The activity will consist of searching for poor performing network elements revealed by the inspection of the different metrics available.
To implement the detection task, the NaaS operator will establish decision rules applied to the monitoring results for triggering any performance degradation affecting the quality. Degradations with respect to baseline performance will include among others: decrease in the availability, Increment in the network delay and packet loss.
When required, it will be necessary to activate and manage the needed operational and / or maintenance network processes to solve the fault or degradation (open tickets to NOC with specified format and diagnosis done, with and specified SLA to solve in case of service affecting incidents) (please refer to Network Operation Center (NOC) Module for additional information on NOC activities).
Analysis and Diagnostic
This activity includes the problem definition and the impact assessment (when / where / how much) as well as the root cause Identification and its nature (network congestion; network faults; capacity-related events; ‘)
The analysis and diagnosis of detected Tx performance issues will consider use of the different data sources, as described in section 3.
The following data inputs will be the main ones to be used to troubleshoot detected issues:
Solution Implementation
Definition of the solution plan and implementation mgmt by using the appropriate procedures available, depending on the nature of the action.
It’s possible that the action plan needs to be executed by other teams using the inputs generated: maintenance issues, malfunctioning hardware / software to be fixed / replaced, recommendations to deploy additional capacity.
4.2 Areas of Interest
This section aims to examine the most relevant network areas that NaaS operators should consider as part of the Tx performance mgmt process, along with the most frequent events that impact the transport network performance and the typical measurement methods. Finally, standard methods are presented to be implemented in NaaS operator’s transport network to mitigate performance issues.
4.2.1 Network Delay
Network delay is a performance characteristic that comprises the different aspects involved in the traffic path across the transport network (e.g., transmission delay, propagation delay, processing delay, queuing delay).
In the transport network, many factors directly affect the transport network delay characteristics. Some examples include the following:
The following subsections examine different characteristics of the network delay.
4.2.1.1 Round-trip time (RTT)
RTT is used to measure the expected time for network interaction between two hosts on a network. RTT is defined as the time it takes a packet to reach its destination and a response to return to the source.
RTT is an important metric to determine the health of the transport network, as an increment in its value can indicate network congestion or a network fault.
Table 4 displays typical target values for the RTT across the transport network segments.
|
Round-trip time Target Values |
|
|
Last-mile |
< 40 ms |
|
Aggregation |
< 10 ms |
|
Satellite Link |
< 750 ms |
Table 4 — Typical target values for RTT in the transport network
Measurement Procedures
Typically, RTT is measured using active methods, which require the observations of test packets transmitted in both directions between two endpoints across a network.
One endpoint acts as the "source" host, which sends the first packet, and a "destination" host, which receives the first test packet and sends a test packet back to the source in reply. The round-trip delay is then calculated as the difference between the time at which the reply is received at the source and the time at which the original test packet was sent.
The Internet Engineering Task Force (IETF) has defined the two-way active measurement protocol (TWAMP) for RTT measurement. Modern transport equipment usually supports these types of measurements across multivendor equipment.
Alternatively, ICMP packets can be used to perform these measurements. These measurements can be performed using passive (e.g., by examining existing ICMP packets in the network) and active methods (e.g., configuring periodic packets generated by network equipment). This method’s limitations are that the calculated measurements do not accurately reflect the network behavior for a specific traffic type. Therefore, it should only be used when TWAMP measurements are not feasible to implement.
Improvement Actions
The following actions can be implemented to reduce the RTT in the transport network:
4.2.1.2 Jitter (Delay variation)
Jitter is used to measure the variation in a sequence of RTT values over time and describes the disruption in the normal sequence of sending data packets. This is particularly relevant to traffic that requires relatively constant delay (e.g., voice over IP (VoIP) traffic).
Table 5 displays typical target values for the jitter across the transport network segments.
|
Jitter Target Values |
|
|
Last-mile |
< 10 ms |
|
Aggregation |
< 5 ms |
|
Satellite Link |
< 20 ms |
Table 5 — Typical target values for jitter in the transport network
Measurement Procedures
Jitter is typically measured using active methods. Similarly to RTT, TWAMP can be used to measure jitter in the transport network by sending test packets and monitoring their experience in the network.
Improvement Actions
The following actions can be implemented to reduce the jitter in the transport network:
4.2.2 Availability
The availability of the transport network refers to the proportion of time the network is in a functional condition, which is vital to maintain a good network performance. Furthermore, it represents the reliability of the individual components in a network.
Different events can diminish the total availability of the transport network elements, such as:
Table 6 displays typical target values for the availability across the transport network segments.
|
Availability Target Values |
|
|
Last-mile |
> 99.9% |
|
Aggregation |
> 99.99% |
|
Satellite Link |
> 99.5% |
Table 6 — Typical target values for availability in the transport network
Measurement Procedures
The availability measurements typically use a combination of active and passive methods based on the statistics collected from the managed devices. In this way, the total availability of a certain network topology can be estimated by measuring the individual components of it (i.e., link availability, device availability).
The methodology to calculate the theoretical availability of a transport network topology is provided in the Tx & IP Architecture Module.
Improvement Actions
The most common practice to increase the overall availability of the transport network is to implement redundancy methods. In this way, there is still a redundant element to handle the traffic in case of failure of a particular element. The following schemes can be implemented to improve the total availability of the transport network:
4.2.3 Packet Loss
Packet loss denotes the expected probability that a transmitted packet will reach its destination, and is usually expressed as a percentage. It can be used to estimate the network’s delivery reliability.
The most common causes of packet loss includes the following events:
Table 7 displays typical target values for the packet loss requirements across the transport network segments.
|
Packet loss Target Values |
|
|
Last-mile |
< 0.1% |
|
Aggregation |
< 0.1% |
|
Satellite Link |
< 0.5% |
Table 7 — Typical target values for packet loss in the transport network
Measurement Procedures
Packet loss measurements always include the sending of test packets from a sender to a packet receiver in a predefined sending schedule and/or pattern; the receiver will then count these packets. It’s highly recommended that test packets part of packet loss measurements are treated like the background traffic of interest.
TWAMP can be used to measure packet loss in the transport network by sending test packets and monitoring their experience in the network.
Alternatively, a passive method can be used. In this way, the packet loss is measured through the packet error/discarded counters in the network elements. This method’s limitation is that the calculated measurements may not consider the packet loss in non-monitored elements (e.g., third-party network elements). Therefore, it should only be used when active methods are not feasible to implement.
Improvement Actions
The following actions can be implemented to improve the total availability of the transport network:
4.2.4 Resiliency
Transport networks, especially in rural environments, are prone to failures that can occur in their nodes or the links. In the event of a failure, it’s essential that the network recovers as quickly as possible, which is known as network resiliency.
The continuity of the services in 4G networks is a critical requirement because the applications that are supported on these networks have increasingly strict limits in terms of recovery time in the event of a failure.
Table 8 displays the typical target recovery time for different services:
|
Service |
Recovery Time Target Values |
|
Web Browsing |
< 1 s |
|
Streaming |
< 1 s |
|
Voice |
< 200 ms |
Table 8 — Typical target values for Packet Loss in transport network
To avoid an impact on the service, it’s necessary that the network completes the ‘convergence’ process in less time than the recovery time for each service in the event of a failure. Network convergence is defined as the process of synchronizing the forwarding and routing tables in the different network elements after a change in the topology.
It’s highly recommended to include methods to ensure the fast convergence of the network; these methods are: fast convergence methods and protection switching methods. The following subsections examine the most common methods to be implemented in the transport network.
4.2.4.1 Fast Convergence Methods
Different fast convergence methods can be implemented in transport networks, allowing the network to stabilize and return to a fully operational state in less than 1 second. The most common fast convergence methods are described on the following page:
Bidirectional Forwarding Detection (BFD)
Bidirectional forwarding detection (BFD) is a fault detection protocol that provides a low-overhead, short-duration method to determine a communication failure between devices and notify upper-layer applications (also called clients). BFD is a detection protocol that can be enabled at the interface and routing protocol levels.
For instance, a network running the open shortest path first (OSPF) as a routing protocol, takes several tens of seconds to recover from a failure, using the default parameter settings. The main component of this delay is the time required to detect a failure using the timeout-based detection method. In contrast, BFD can be configured to detect link failures in up to 50 ms, which leads to a significant decrease in network recovery time.
It’s recommended to enable BFD in interfaces and routing protocol levels only on the elements located in the aggregation segment.
BGP Fast Convergence (FC)
It’s a set of features in border gateway protocol (BGP) such as multipath activation, prefix prioritization and event delay (dampening) to avoid recalculating routes in cases where IGP convergence is sufficient to keep the service and routes intact.
It’s recommended to enable BGP Fast Convergence only in the routing equipment that supports BGP protocol located in the aggregation segment.
Graceful Restart
After a failure in a node with redundancy in control cards or after a reboot, it maintains the forwarding and routing tables, allowing the restoration of services more quickly without having to exchange link-state protocol data units (LSPs) or recalculate shortest-path-first (SPFs).
It’s recommended to enable the graceful restart functionality only in the routing equipment that supports OSPF and BGP protocols to avoid the delay caused by the initialization process of these protocols after recovering from a failure where there were no changes in the topology.
4.2.4.2 Protection Switching Methods
Protection switching methods reestablish connectivity through precalculated redundant links or paths, and they can do this reset within a few milliseconds after detecting the failure. The most common available methods are illustrated on the following page:
Link Aggregation
Link aggregation supports combining multiple Ethernet links into a group, which is seen as a single link. The benefits are an increment in capacity as well as resiliency, as failure of a single link is tolerated. Furthermore, link aggregation also allows load sharing, which is otherwise not supported by Ethernet.
Link aggregation group (LAG) can be implemented in aggregation segments as a redundancy method to reach the target availability.
Router Redundancy Protocols
Router redundancy protocols (e.g., virtual router redundancy protocol (VRRP), hot standby router protocol (HSRP)) can be considered a form of L3 redundancy. The operational principle is to allow multiple routers to share a virtual IP and MAC address. There is one router elected as the master that assumes the role of forwarding the packets sent to the virtual IP address while the rest of the routers act as backup. In case the master fails, one of the backups becomes the master router.
Router redundancy protocols can be implemented in aggregation segments as a redundancy method to reach the target availability. The specific selection of the protocol varies according to the selected Tx equipment.
IP Fast Reroute
In these methods, there is at least one backup route that is installed in the forwarding tables; in such a way that when the failure is detected, the backup path is activated, allowing a service restoration in a few milliseconds after detection.
It’s recommended to enable IP fast reroute functionality only on the elements located in the aggregation segment.
4.2.5 Quality of Service
The mgmt of the quality of service (QoS) is a crucial element in the Tx performance mgmt that indicates how to handle traffic within a network. The fundamental objective of managing the quality of service is to manage the dispute for network resources and maximize the experience of the end user of a session.
The concept of QoS used in transport networks is done through the use of differentiated services (DiffServ) classes. The main idea is to mark the priority traffic so that it isn’t affected by possible congestion due to the fluctuation of link use level. The definition of these elements is examined broader in the Tx & IP Architecture Module.
To prevent network congestion, it’s highly recommended to include methods to ensure the prioritization of certain traffic types in the network, these methods are known as congestion mgmt methods. The following subsections examine the most common methods to be implemented in the transport network.
4.2.5.1 Congestion Management Methods
Every time packets enter into devices faster than they can exit, there is a possibility of congestion. Network congestion may impact Tx performance KPIs and ultimately degrade the transport network services. To avoid and mitigate the occurrence of network congestion, different congestion mgmt methods can be implemented. Below the most common methods that can be implemented in the transport network.
Packet Scheduling Methods
Packet scheduling handles congestion mgmt within the transport network and must be implemented in any interface that can experience congestion. When congestion occurs, packets should be temporarily stored or queued in temporary storage for subsequent scheduling.
Commonly used queue types in the transport network are:
The typical configuration for the packet scheduling methods in the transport network is displayed in Table 9.
Packet Dropping Methods
Buffering memory is a limited resource on any interface. By queuing, buffers fill up and packets can be discarded. The most common discard methods to be implemented in transport networks are:
The typical configuration for the packet dropping methods in the transport network is displayed in Table 9.
|
Traffic type |
Assign Queue |
Packet drop method |
|
Voice Traffic |
Priority queuing’ (PQ) |
Tail drop |
|
Signaling Traffic |
WFQ |
WRED |
|
High-priority Data Traffic |
WFQ |
WRED |
|
Low-priority Data Traffic |
Default Queue |
WRED |
Table 9 — Typical QoS methods in the transport network
4.3 Tx Performance Management Tools
This section examines the most common commercial tools that are specialized in the performance analysis of transport network data from specific data sources. More tools on each category can be found in the Tx performance mgmt tool list.
4.3.1 Network Performance Monitoring System
A network performance monitoring system monitors the network for performance and performs additional activities such as network traffic bottlenecks identification. More details regarding the selection of these tools can be found in the Network Monitoring Architecture Module.
Tool: Atrinet NetACE
Link: https://www.atrinet.com/netace/#
NetACE is a vendor-agnostic solution that allows unified monitoring and control over a multivendor network in a global multi-site topology. A high-level overview of the entire network allows NetACE to define alternative routes in case of fault, to quickly and without errors rollout a new service across the network, and to immediately replace settings for a faulty component.
Main features include:
4.3.2 Interfaces Probes Data Analysis
These tools implement and manage a set of probes along the network to monitor the performance. More details regarding the selection of these tools can be found in the Network Monitoring Architecture Module.
Tool: Empirix Diagnostix and Holistix Applications
Link: https://www.empirix.com/products/diagnostix/
Diagnostix is a set of applications that help operations teams quickly identify service-impacting issues and their true root cause across networks, services, devices, and applications. It provides granular insight into call and data sessions to provide an accurate view of network performance and customer experience.
Main features include:
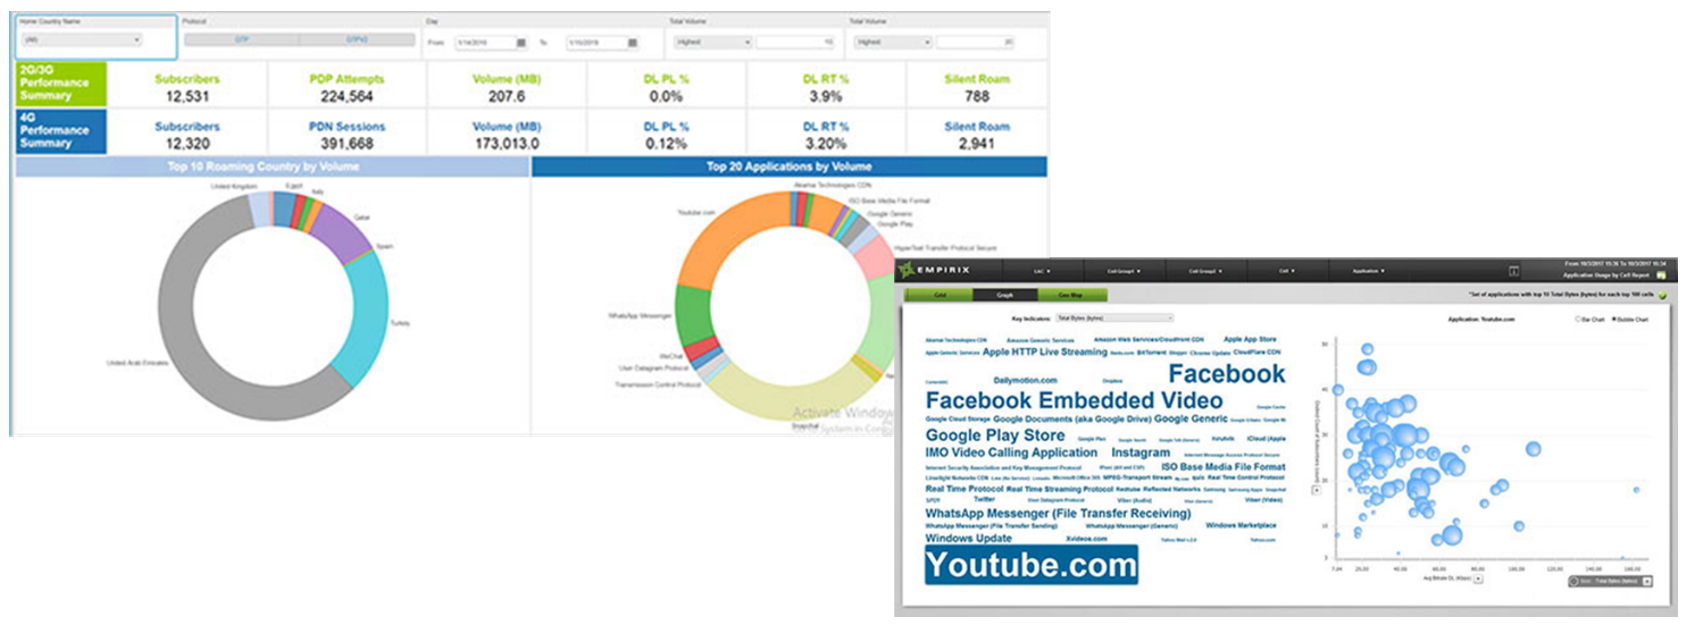
Figure 7 — Empirix Probes Data analysis
4.3.3 Network Inventory Management
Network Inventory tools maintain a record of information regarding all elements in the network. More details regarding the selection of these tools can be found in the Network Operation Center (NOC) Module.
link
Tool: TeleworX mapvista
Link: https://www.teleworx.com/products.html#features11-24
MapVista integrates a versatile network model inventory with the power of geographic analysis to provide a truly integrated E2E network planning capability. It integrates workflow and document mgmt modules to facilitate integration with existing corporate systems.
MapVista main functionalities include:
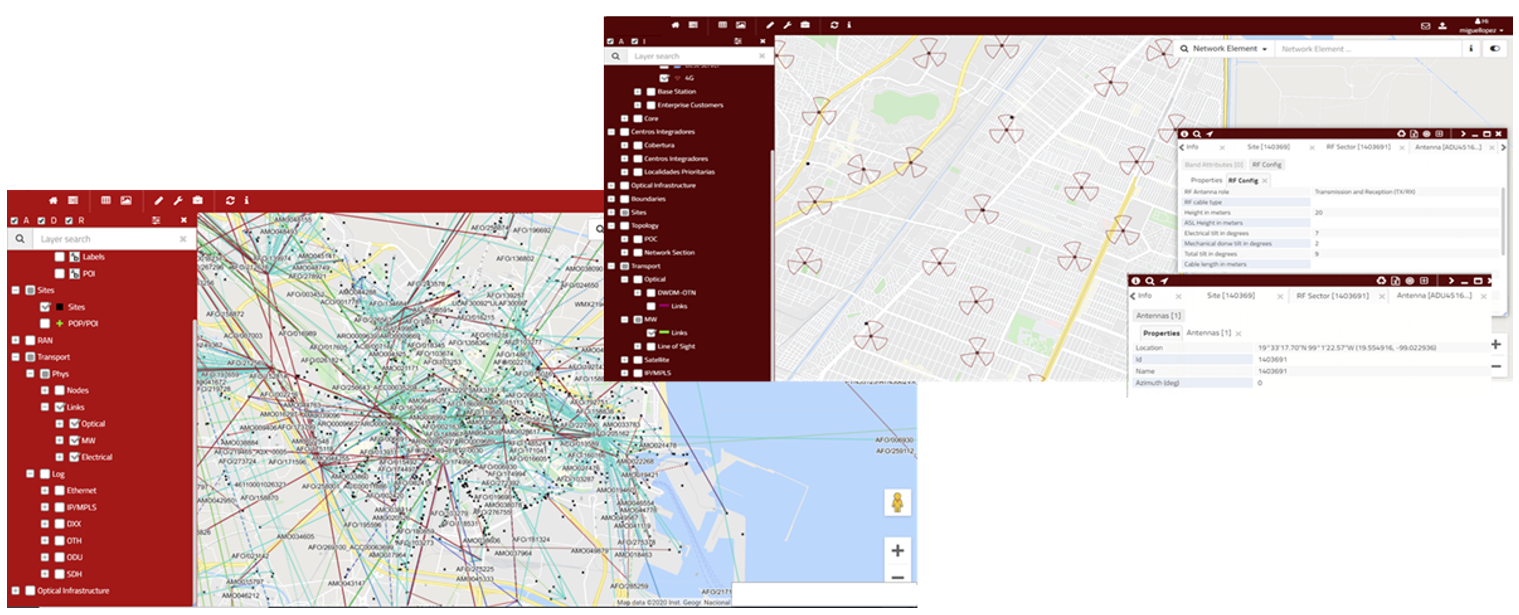
Figure 8 — TeleworX mapVista NW Inventory
4. TX PERFORMANCE MANAGEMENT PROCESS
4.1 Process Overview
4.2 Areas of Interest
4.3 Tx Performance Management Tools
